
Biology Art
Patterns, textures & unexpected beauty.
A visual collection from our research.
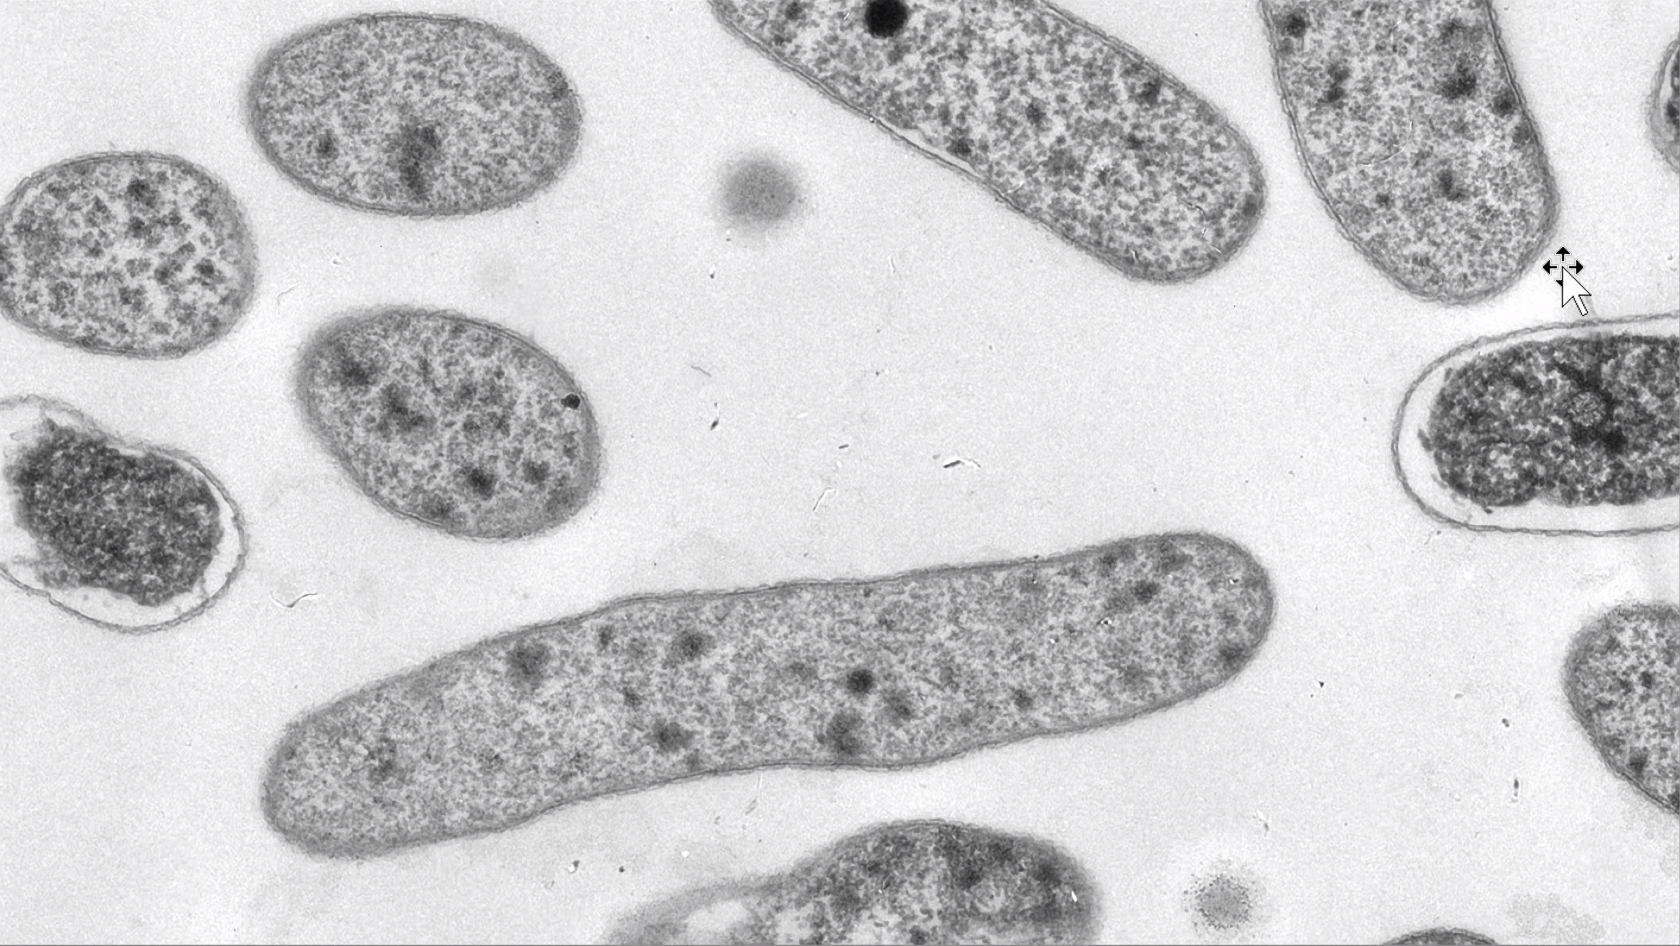
Cellular forms
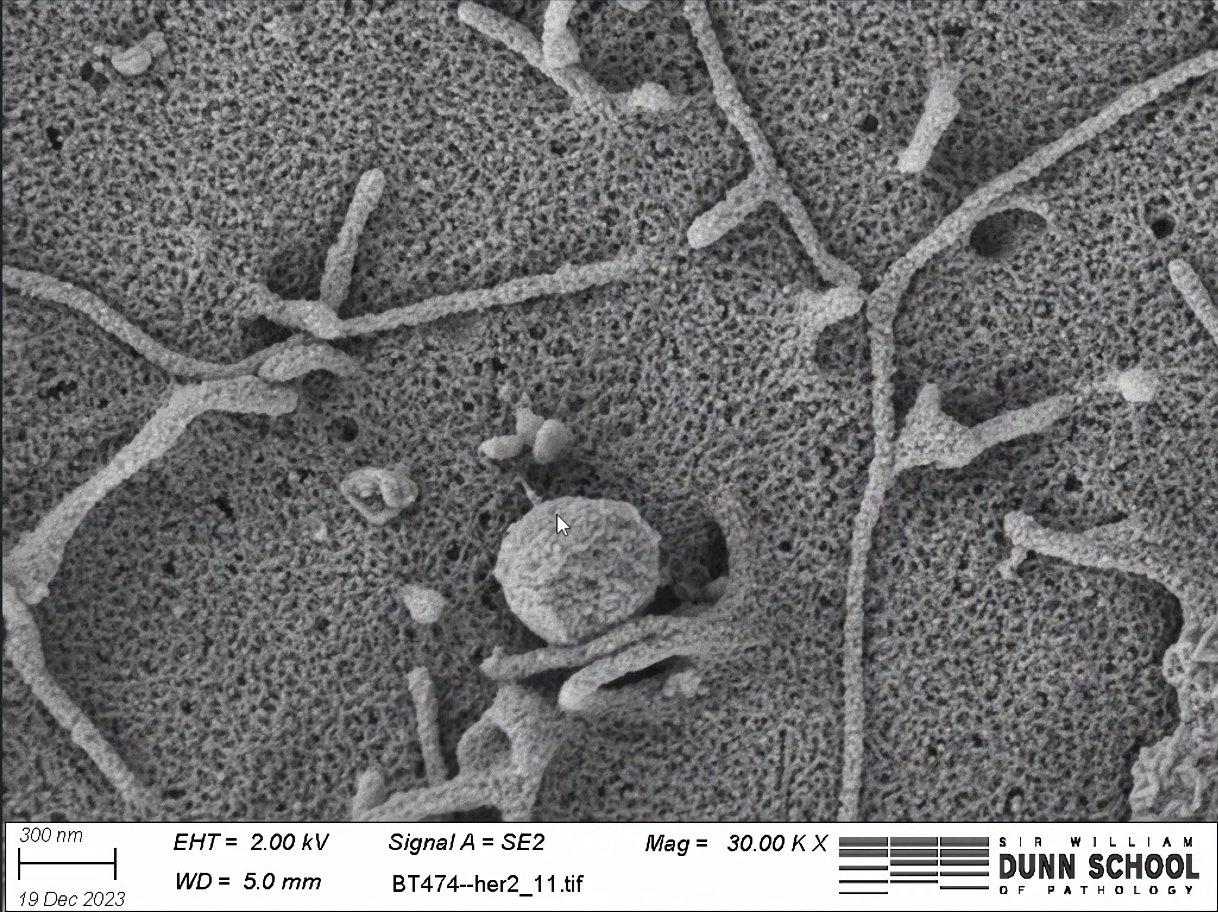
Surface landscape
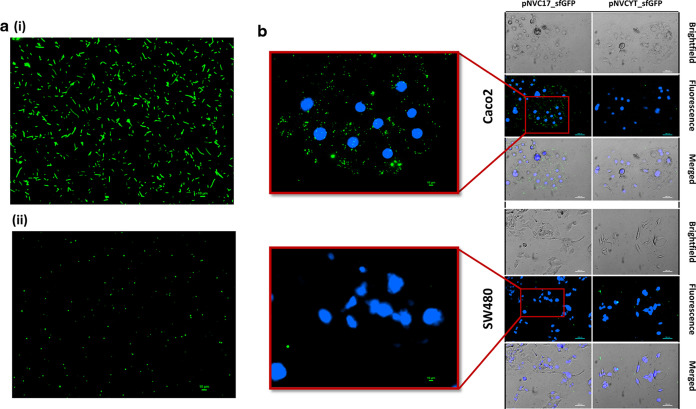
Signals in green
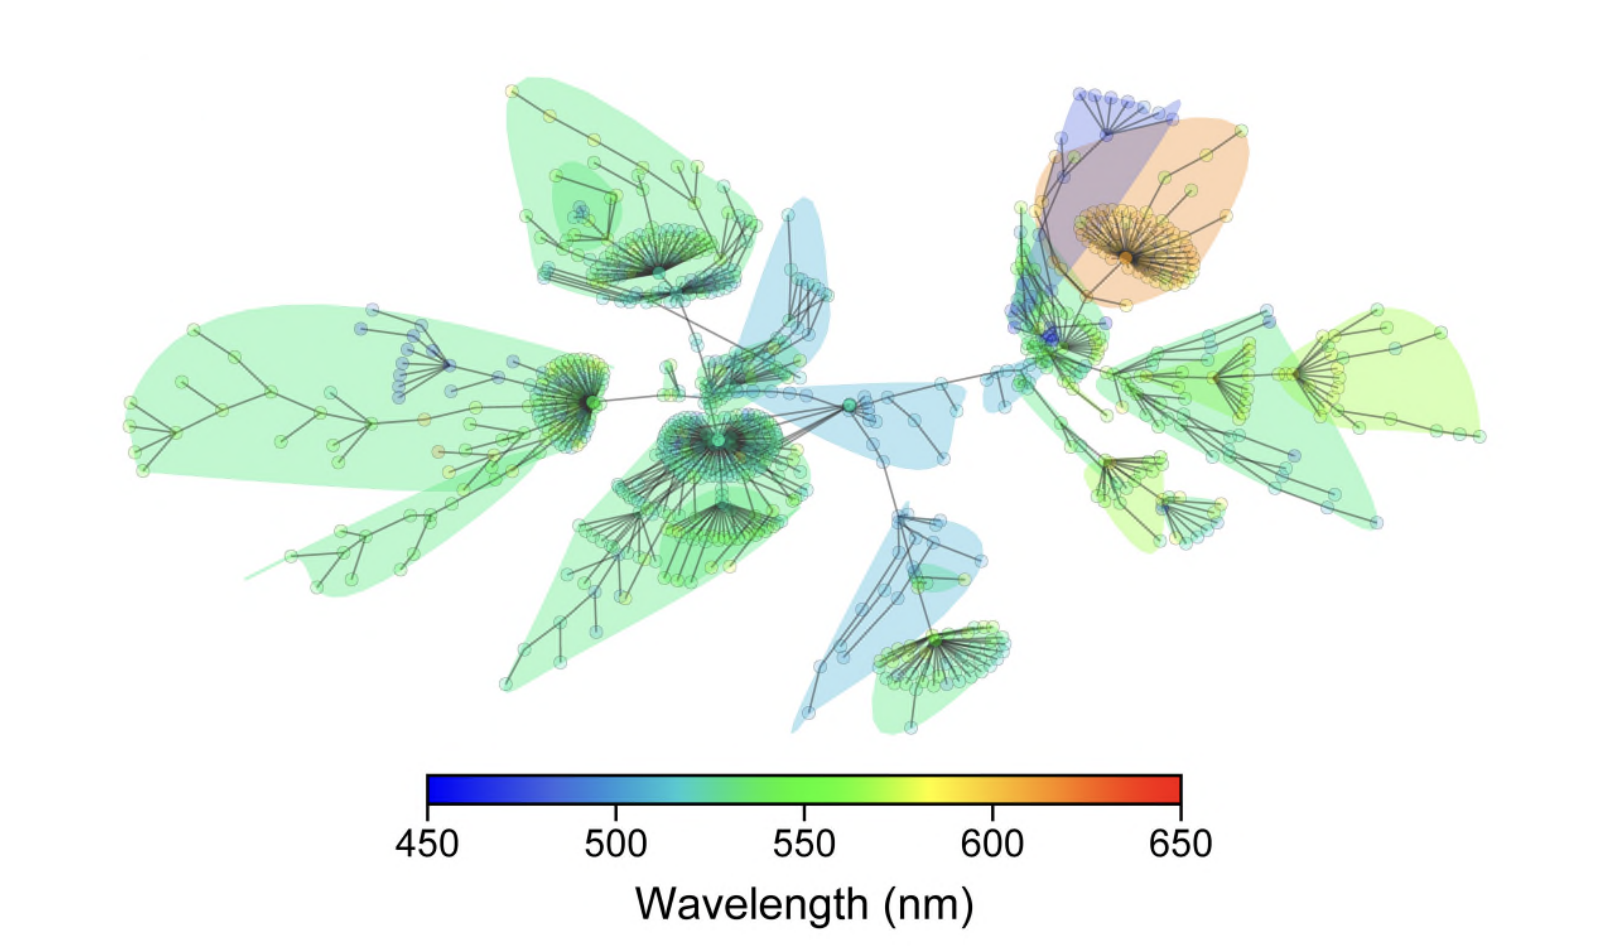
A spectrum of connections
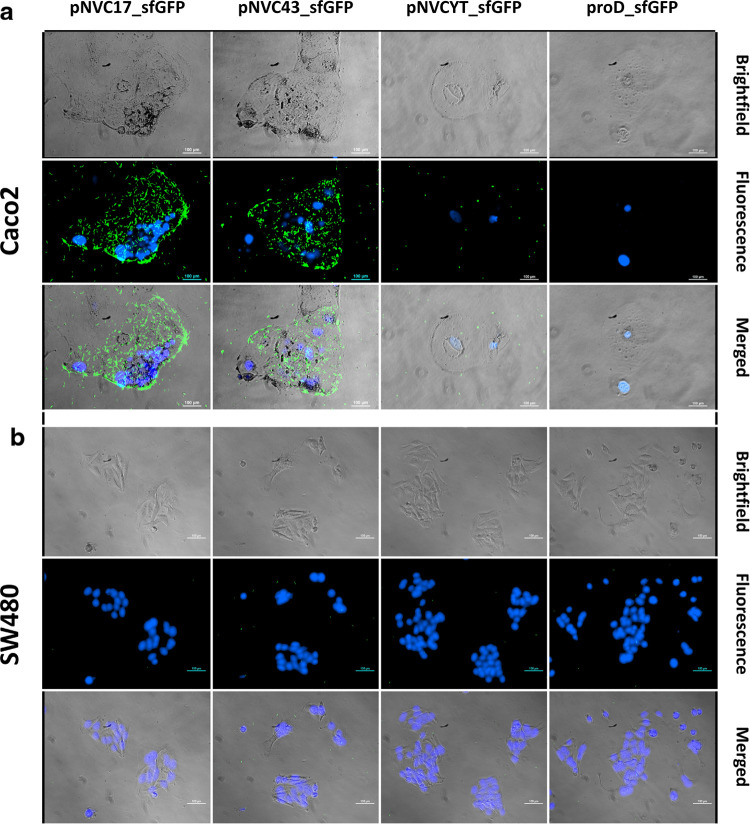
Cellular constellations
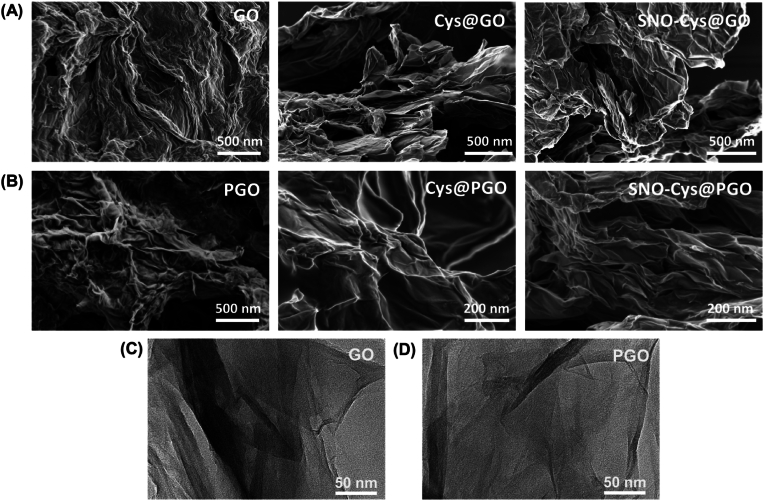
Folded landscapes
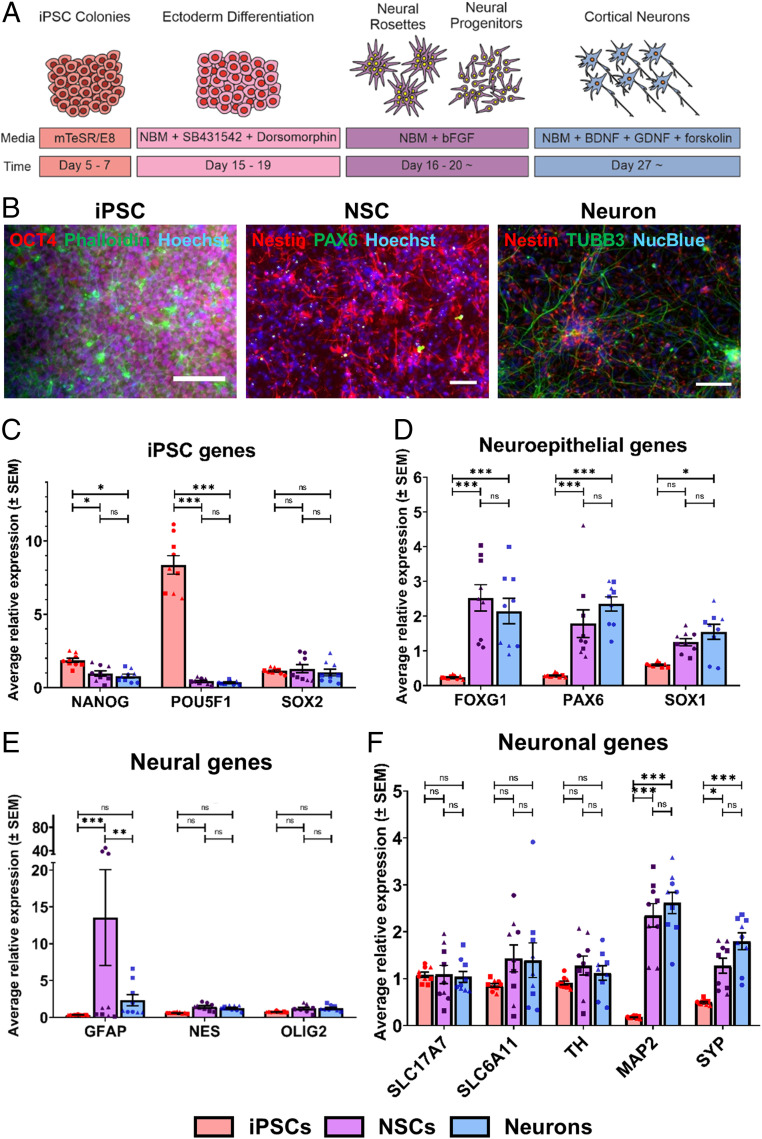
Neural beginnings
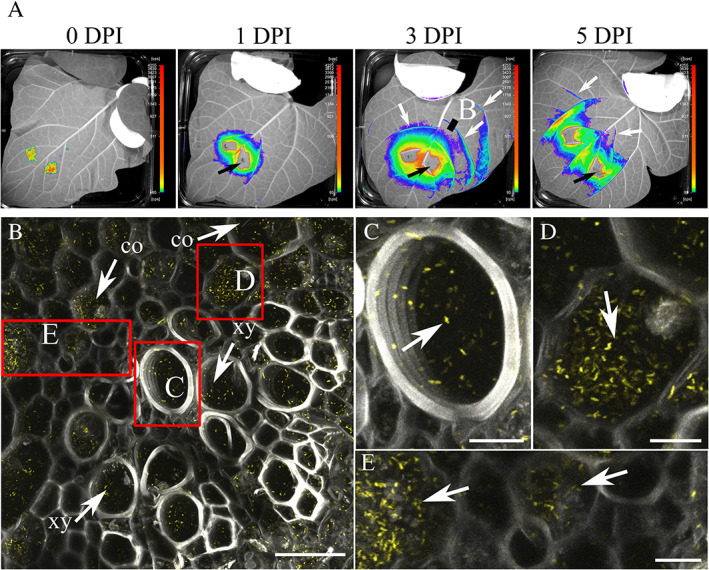
Within a leaf
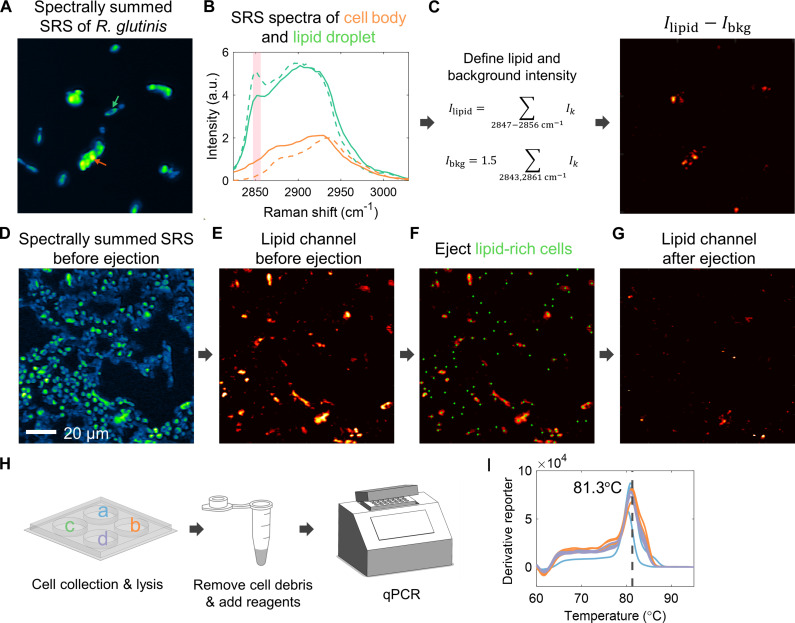
A metabolic mosaic
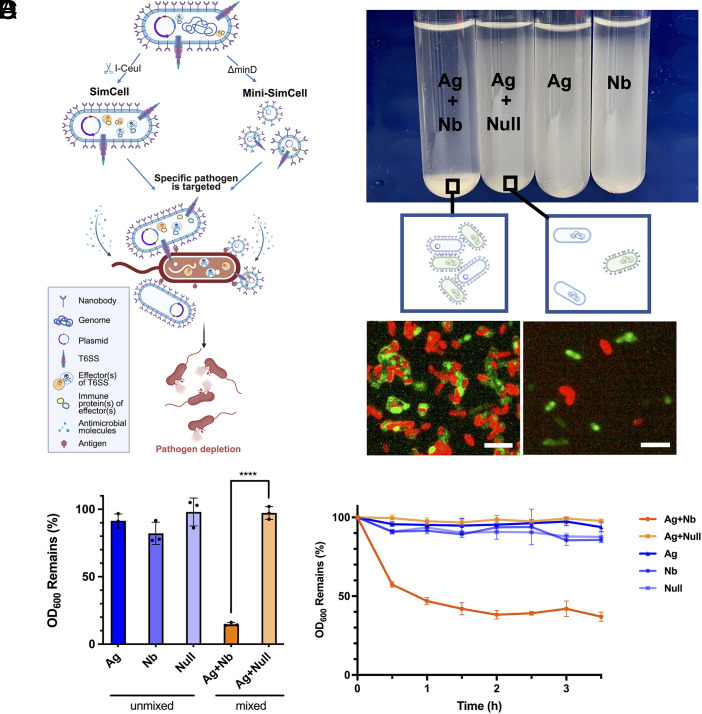
Red meets green
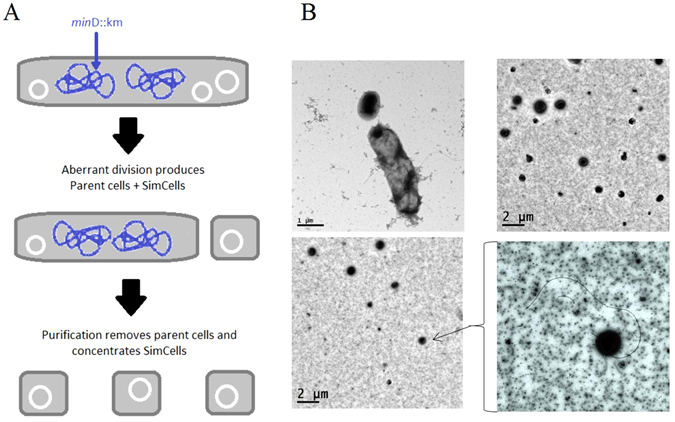
Small worlds
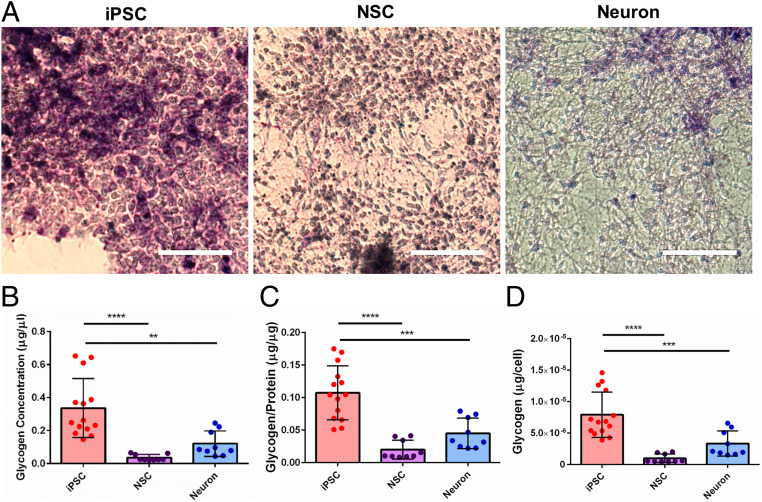
Violet textures
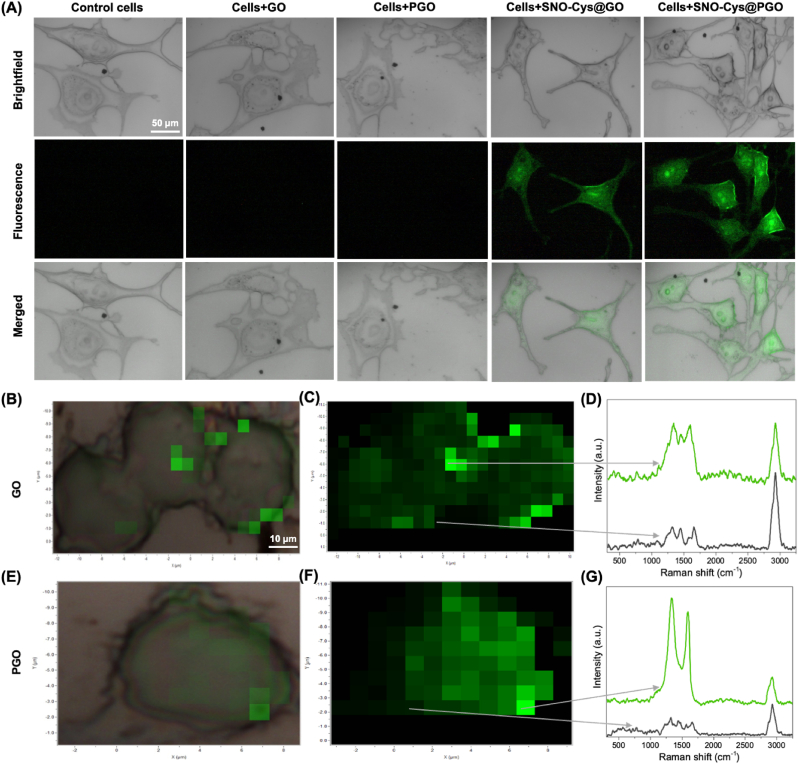
Light within cells
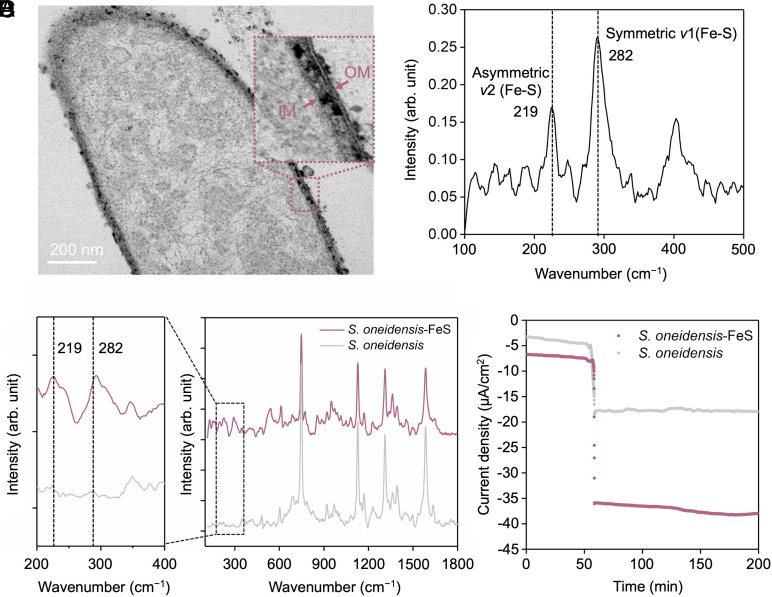
At the membrane
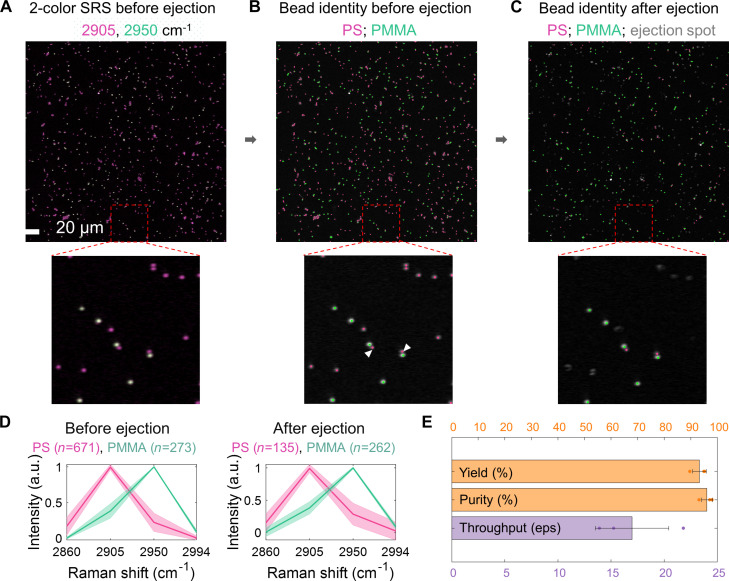
Raman stardust
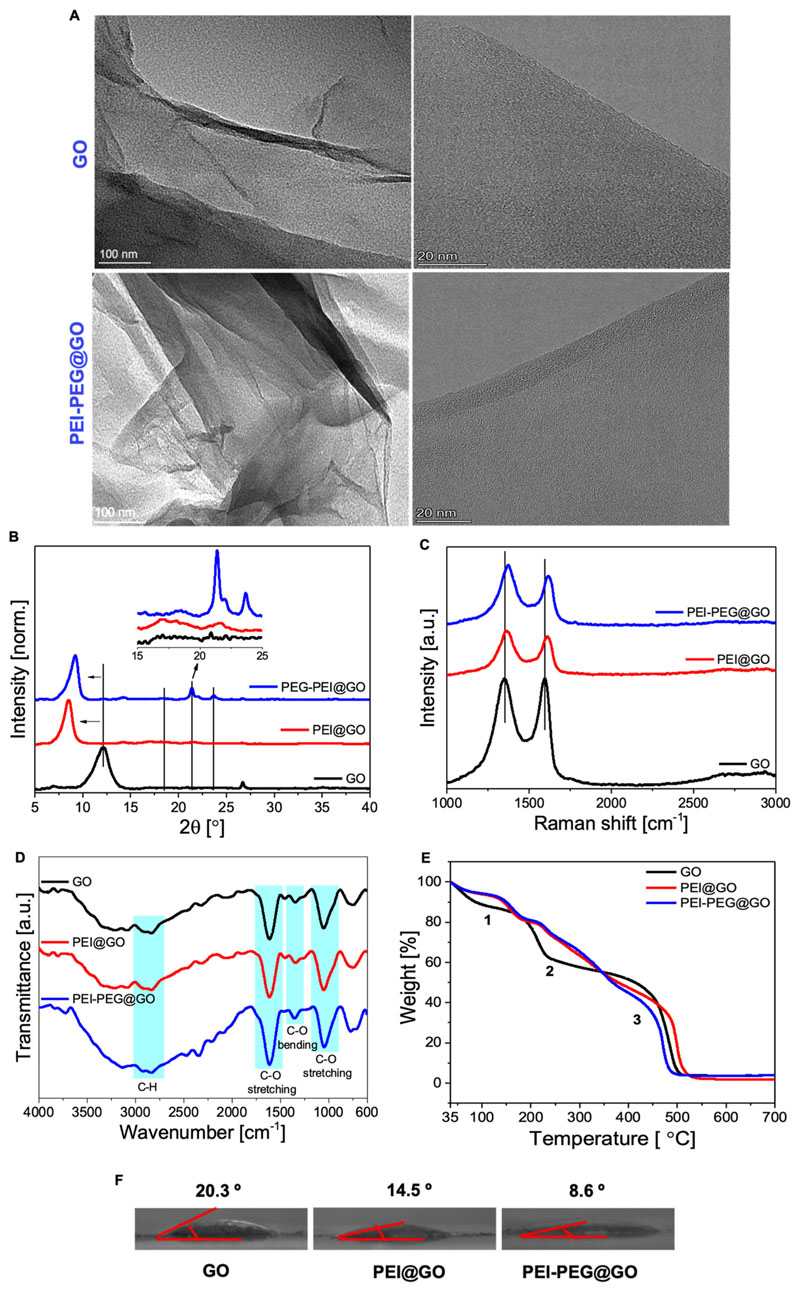
Layers of carbon
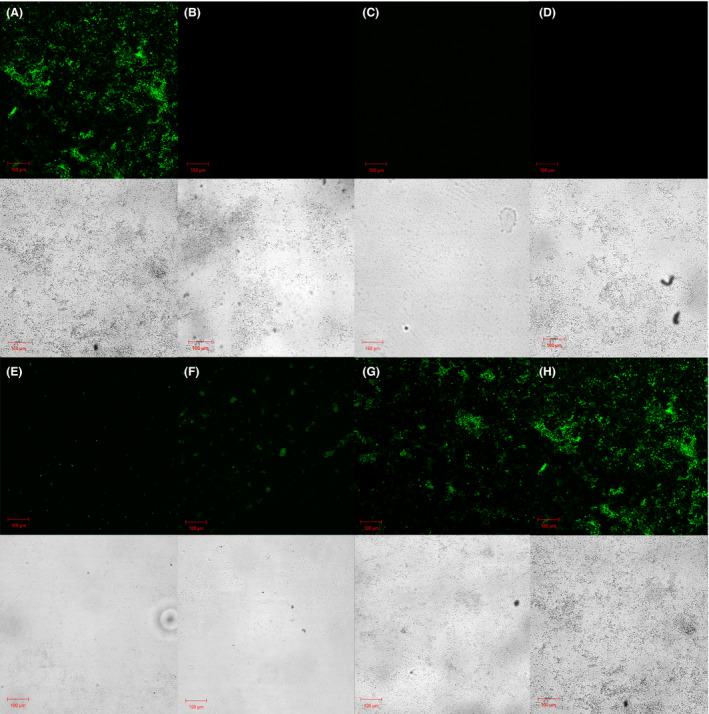
Biofilm in green
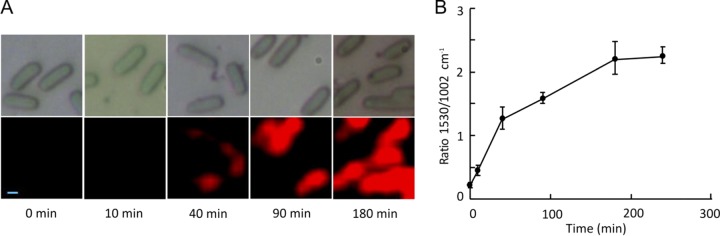
A red signature
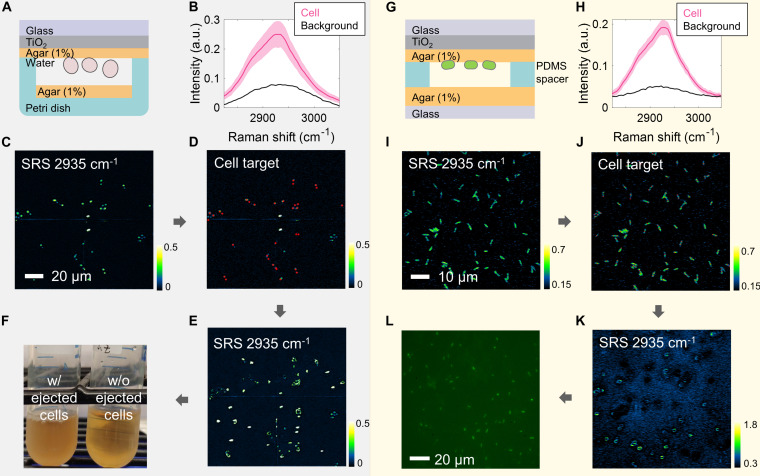
Cells in blue
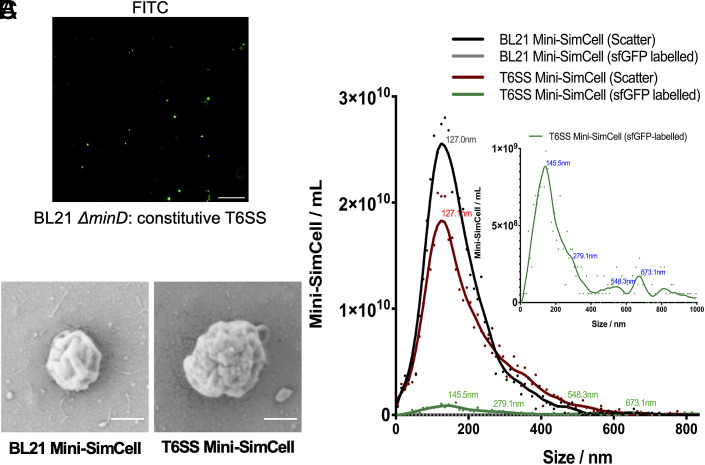
Miniature forms
Tissue in light
Points of expression
Local signals
An encounter in colour
Carbon silk
A red interior
Blue tributaries
Neural tapestry
A living canopy
A small dark moon
Amber signals
Mineral folds
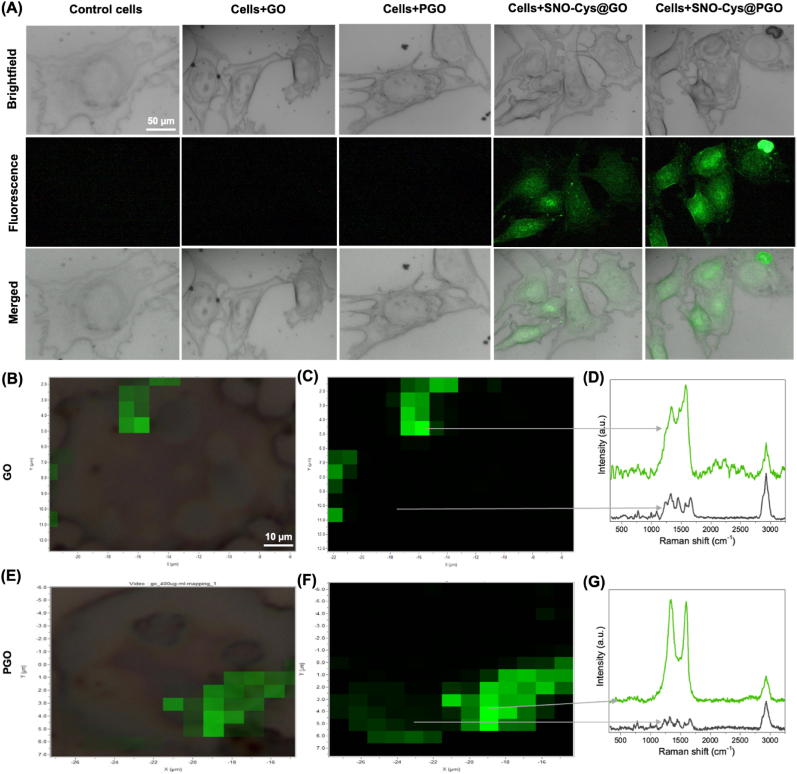
Emerald interiors
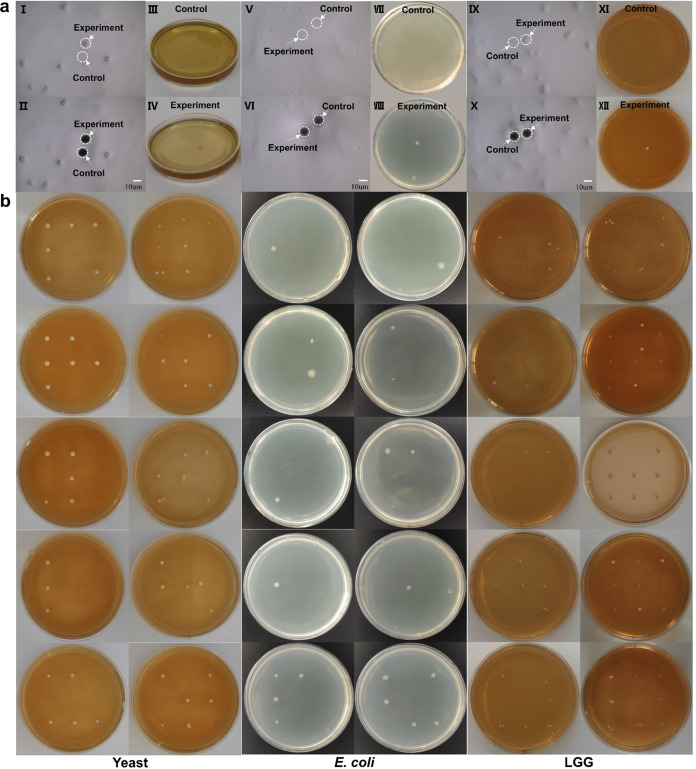
Circles of growth
Within the vessel
Scattered in blue
Translucent layers
Violet interior
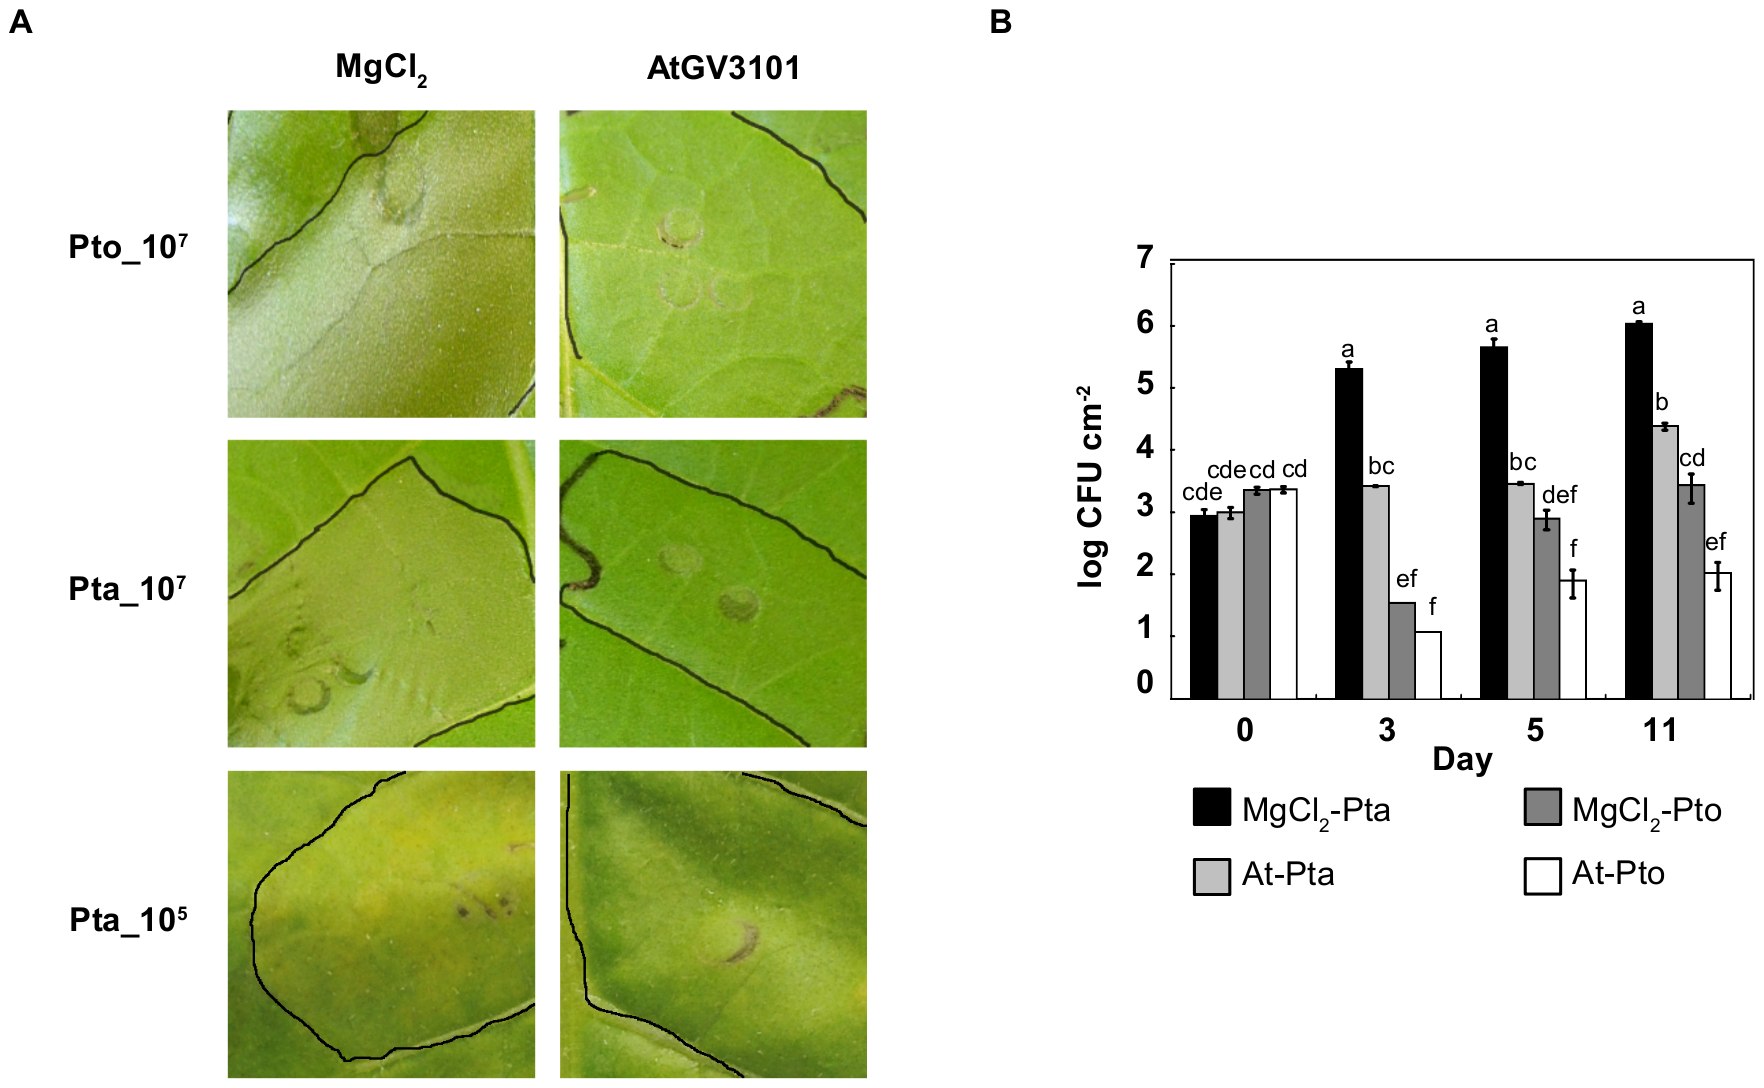
Leaf light
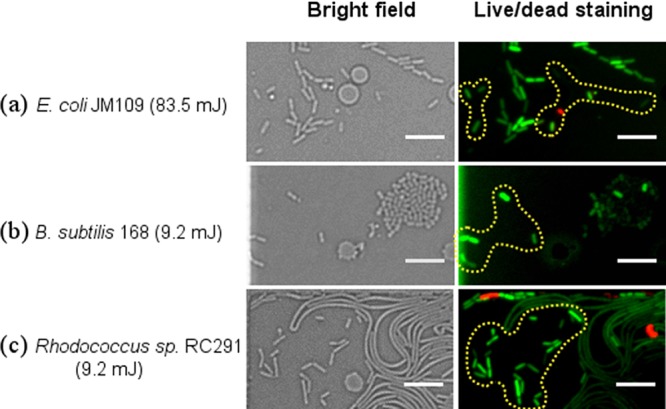
Threads of light
Rose-coloured tissue
Silver ridges
A blue constellation
Tiny satellites
Metabolic islands
Cellular calligraphy
Green architecture
An emerald halo
Soft ripples
A golden section
Between the walls
A cellular constellation
Cell in silver
Veins and gradients
A different perspective on the living world. Select an image to see the full view.
Image notes & sources
- 01 — Cellular forms
A closer view of cellular outlines and internal textures. Image supplied by Huang Lab.
- 02 — Surface landscape
A landscape of fine textures and branching forms. The full image retains its scale bar and acquisition information. Image supplied by Huang Lab. Original image marked Sir William Dunn School of Pathology, 19 December 2023.
- 03 — Signals in green
The gallery shows a detail from Figure 3a(i). The complete figure documents mini-SimCell purification and cancer-cell targeting experiments in vitro. Lim et al. (2022) · Figure 3 · CC BY 4.0. Gallery preview is cropped; the original figure is shown here.
View source ↗ - 04 — A spectrum of connections
Relationships between rhodopsin sequences, coloured by absorption wavelength. An image from research on AI-guided rhodopsin design. Saeed et al. (2026) · Preprint · Figure 2b (adapted) · CC BY-NC 4.0.
View source ↗ - 05 — Cellular constellations
Figure 2a, fluorescence panels: green-labelled engineered bacteria alongside blue-stained Caco2 cancer-cell nuclei in an in vitro adhesion experiment. The gallery preview is a cropped detail; the viewer shows the complete original figure. Lim et al. (2022) · Figure 2 · CC BY 4.0. Reprogramming Synthetic Cells for Targeted Cancer Therapy.
View source ↗ - 06 — Folded landscapes
Figure 3A, first panel: the folded surface of graphene oxide imaged by scanning electron microscopy. The gallery preview is a cropped detail; the viewer shows the complete original figure. Tabish et al. (2024) · Fig. 3 · CC BY 4.0. S-nitrosocysteamine-functionalised porous graphene oxide nanosheets as nitric oxide delivery vehicles for cardiovascular applications.
View source ↗ - 07 — Neural beginnings
Figure 1B: immunostaining of human induced pluripotent stem cells and their neural derivatives. The gallery preview is a cropped detail; the viewer shows the complete original figure. Hsu et al. (2020) · Fig. 1. · CC BY 4.0. A single-cell Raman-based platform to identify developmental stages of human pluripotent stem cell-derived neurons.
View source ↗ - 08 — Within a leaf
Figure 2B: a leaf-vasculature cross section, with bacterial colonies in yellow and plant-tissue autofluorescence in grey. The gallery preview is a cropped detail; the viewer shows the complete original figure. Soldan et al. (2021) · Fig. 2 · CC BY 4.0. From macro to micro: a combined bioluminescence-fluorescence approach to monitor bacterial localization.
View source ↗ - 09 — A metabolic mosaic
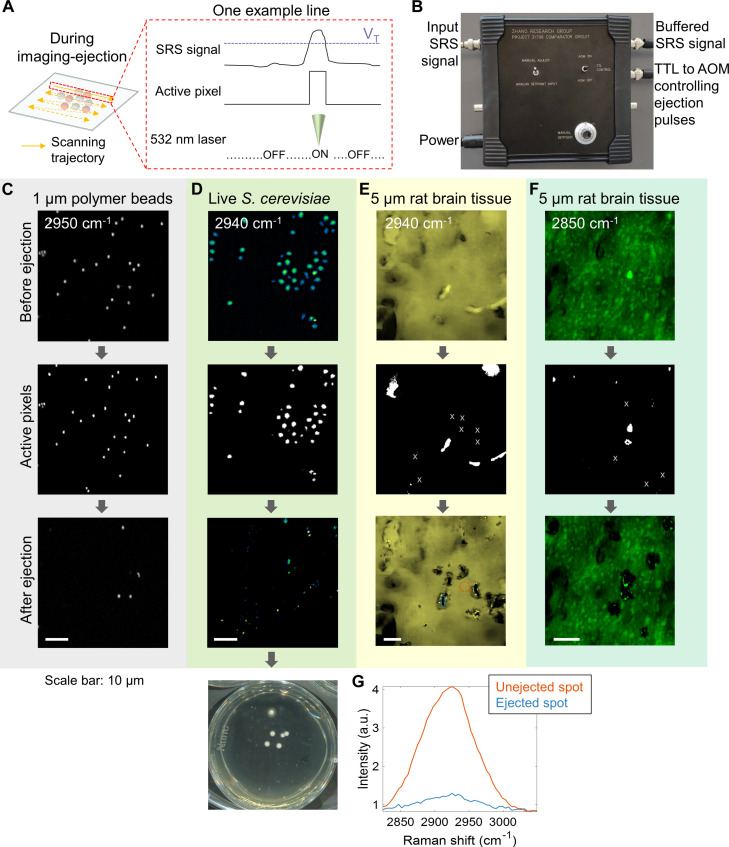
Figure 4D: stimulated Raman imaging of a mixture of R. glutinis and S. cerevisiae before cell sorting. The gallery preview is a cropped detail; the viewer shows the complete original figure. Zhang et al. (2024) · Fig. 4. · CC BY-NC 4.0. High-throughput single-cell sorting by stimulated Raman-activated cell ejection.
View source ↗ - 10 — Red meets green
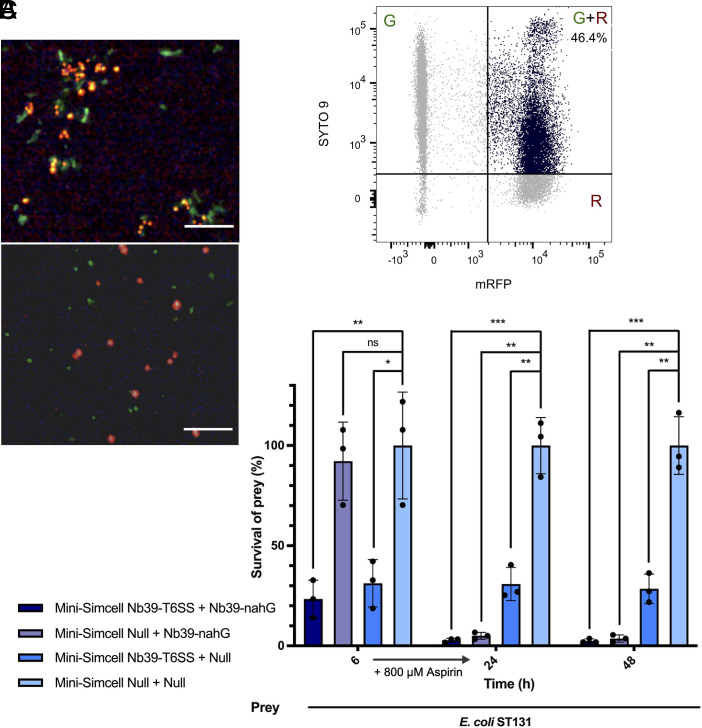
Figure 1B: red- and green-labelled bacteria form aggregates through engineered nanobody–antigen interactions. The gallery preview is a cropped detail; the viewer shows the complete original figure. Dong et al. (2026) · Fig. 1. · CC BY 4.0. Reprogrammed SimCells for antimicrobial therapy.
View source ↗ - 11 — Small worlds
Figure 1B, upper-left panel: E. coli cells producing smaller chromosome-free SimCells. The gallery preview is a cropped detail; the viewer shows the complete original figure. Rampley et al. (2017) · Figure 1 · CC BY 4.0. Development of SimCells as a novel chassis for functional biosensors.
View source ↗ - 12 — Violet textures
Figure 4A, hiPSC panel: periodic acid–Schiff staining in magenta, counterstained with hematoxylin in blue-purple. The gallery preview is a cropped detail; the viewer shows the complete original figure. Hsu et al. (2020) · Fig. 4. · CC BY 4.0. A single-cell Raman-based platform to identify developmental stages of human pluripotent stem cell-derived neurons.
View source ↗ - 13 — Light within cells
Figure 7A, fluorescence detail: nitric oxide-sensitive dye in endothelial cells exposed to a functionalised graphene formulation in vitro. The gallery preview is a cropped detail; the viewer shows the complete original figure. Tabish et al. (2024) · Fig. 7 · CC BY 4.0. S-nitrosocysteamine-functionalised porous graphene oxide nanosheets as nitric oxide delivery vehicles for cardiovascular applications.
View source ↗ - 14 — At the membrane
Figure 2A: a S. oneidensis cell with biogenic iron sulfide nanoparticles in the periplasm and on the outer membrane. The gallery preview is a cropped detail; the viewer shows the complete original figure. Tu et al. (2024) · Fig. 2. · CC BY 4.0. Engineering bionanoreactor in bacteria for efficient hydrogen production.
View source ↗ - 15 — Raman stardust
Figure 2A: a two-colour stimulated Raman image of polymer microbeads used to evaluate single-cell sorting technology. These are calibration particles, not cells. The gallery preview is a cropped detail; the viewer shows the complete original figure. Zhang et al. (2024) · Fig. 2. · CC BY-NC 4.0. High-throughput single-cell sorting by stimulated Raman-activated cell ejection.
View source ↗ - 16 — Layers of carbon
Figure 2a: graphene oxide layers examined by transmission electron microscopy in a study of functionalised coatings for vascular stents. The gallery preview is a cropped detail; the viewer shows the complete original figure. Tabish et al. (2024) · FIG. 2 · CC BY 4.0. Synthesis and characterization of amine-functionalized graphene as a nitric oxide-generating coating for vascular stents.
View source ↗ - 17 — Biofilm in green
Figure 2A: a biofilm showing green fluorescence after ultrasound-mediated plasmid delivery and 120 hours of incubation. The gallery preview is a cropped detail; the viewer shows the complete original figure. Ng et al. (2021) · Fig. 2 · CC BY 4.0. Genetic engineering biofilms in situ using ultrasound-mediated DNA delivery.
View source ↗ - 18 — A red signature
Figure 2A, Raman detail: the red signal maps proteorhodopsin-associated spectral intensity in individual E. coli cells after induction. The gallery preview is a cropped detail; the viewer shows the complete original figure. Song et al. (2019) · FIG 2 · CC BY 4.0. Proteorhodopsin Overproduction Enhances the Long-Term Viability of Escherichia coli.
View source ↗ - 19 — Cells in blue
Figure 3C: stimulated Raman imaging of S. cerevisiae before cell ejection and recovery. The gallery preview is a cropped detail; the viewer shows the complete original figure. Zhang et al. (2024) · Fig. 3. · CC BY-NC 4.0. High-throughput single-cell sorting by stimulated Raman-activated cell ejection.
View source ↗ - 20 — Miniature forms
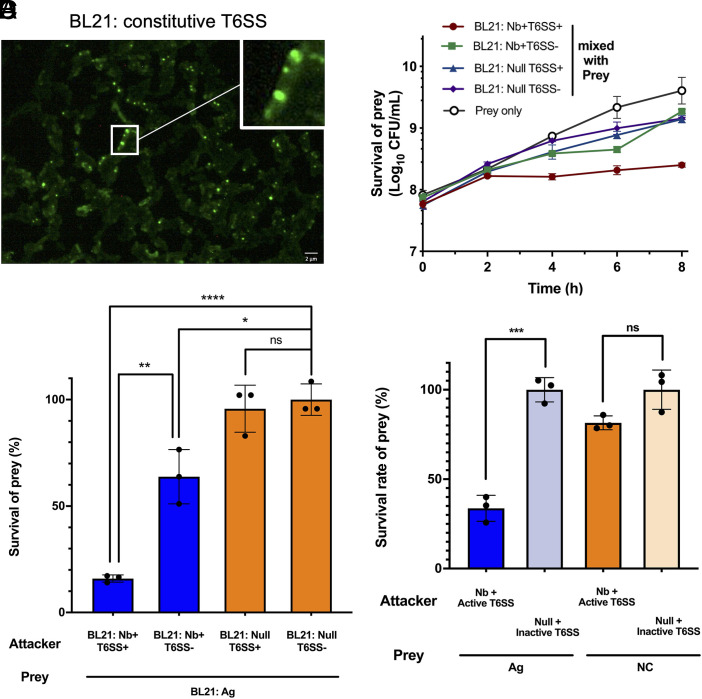
Figure 3B: scanning electron micrographs of mini-SimCells derived from parental cells with and without a type VI secretion system. The gallery preview is a cropped detail; the viewer shows the complete original figure. Dong et al. (2026) · Fig. 3. · CC BY 4.0. Reprogrammed SimCells for antimicrobial therapy.
View source ↗ - 21 — Tissue in light
Figure 5F, upper panel: stimulated Raman imaging at 2850 cm⁻¹ of a five-micrometre-thick rat brain tissue section before microdissection. The gallery preview is a cropped detail; the viewer shows the complete original figure. Zhang et al. (2024) · Fig. 5. · CC BY-NC 4.0. High-throughput single-cell sorting by stimulated Raman-activated cell ejection.
View source ↗ - 22 — Points of expression
Figure 2A, centre panel: GFP fluorescence in induced control bacteria from a study of chromosome-free programmable cells. The gallery preview is a cropped detail; the viewer shows the complete original figure. Fan et al. (2020) · Fig. 2. · CC BY 4.0. Chromosome-free bacterial cells are safe and programmable platforms for synthetic biology.
View source ↗ - 23 — Local signals
Figure 2A: localised green fluorescence from labelled VipA in engineered E. coli, used to examine type VI secretion-system assembly. The gallery preview is a cropped detail; the viewer shows the complete original figure. Dong et al. (2026) · Fig. 2. · CC BY 4.0. Reprogrammed SimCells for antimicrobial therapy.
View source ↗ - 24 — An encounter in colour
Figure 6A, upper panel: a fluorescence image of bacterial aggregation in a nanobody-mediated targeting experiment with E. coli ST131. The gallery preview is a cropped detail; the viewer shows the complete original figure. Dong et al. (2026) · Fig. 6. · CC BY 4.0. Reprogrammed SimCells for antimicrobial therapy.
View source ↗ - 25 — Carbon silk
Figure 3B, middle panel: folds in cysteamine-functionalised porous graphene oxide (Cys@PGO). The gallery preview is a cropped detail; the viewer shows the complete original figure. Tabish et al. (2024) · Fig. 3 · CC BY 4.0. S-nitrosocysteamine-functionalised porous graphene oxide nanosheets as nitric oxide delivery vehicles for cardiovascular applications.
View source ↗ - 26 — A red interior
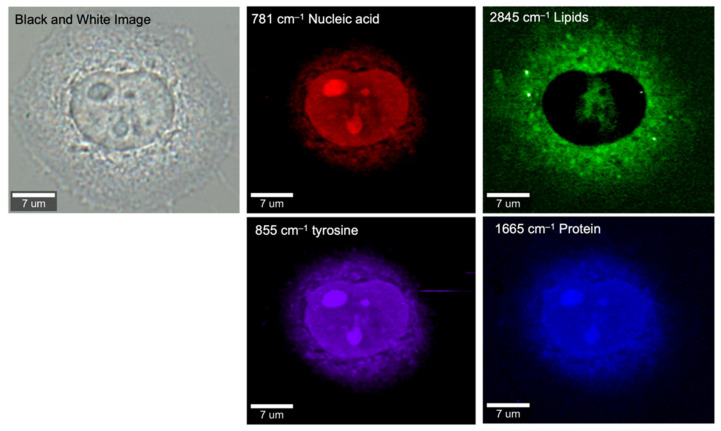
Figure 4, nucleic-acid channel: a HeLa cell mapped at 781 cm⁻¹. Red encodes Raman intensity, not natural cell colour. The gallery preview is a cropped detail; the viewer shows the complete original figure. Xu et al. (2021) · Figure 4 · CC BY 4.0. Unveiling Cancer Metabolism through Spontaneous and Coherent Raman Spectroscopy and Stable Isotope Probing.
View source ↗ - 27 — Blue tributaries
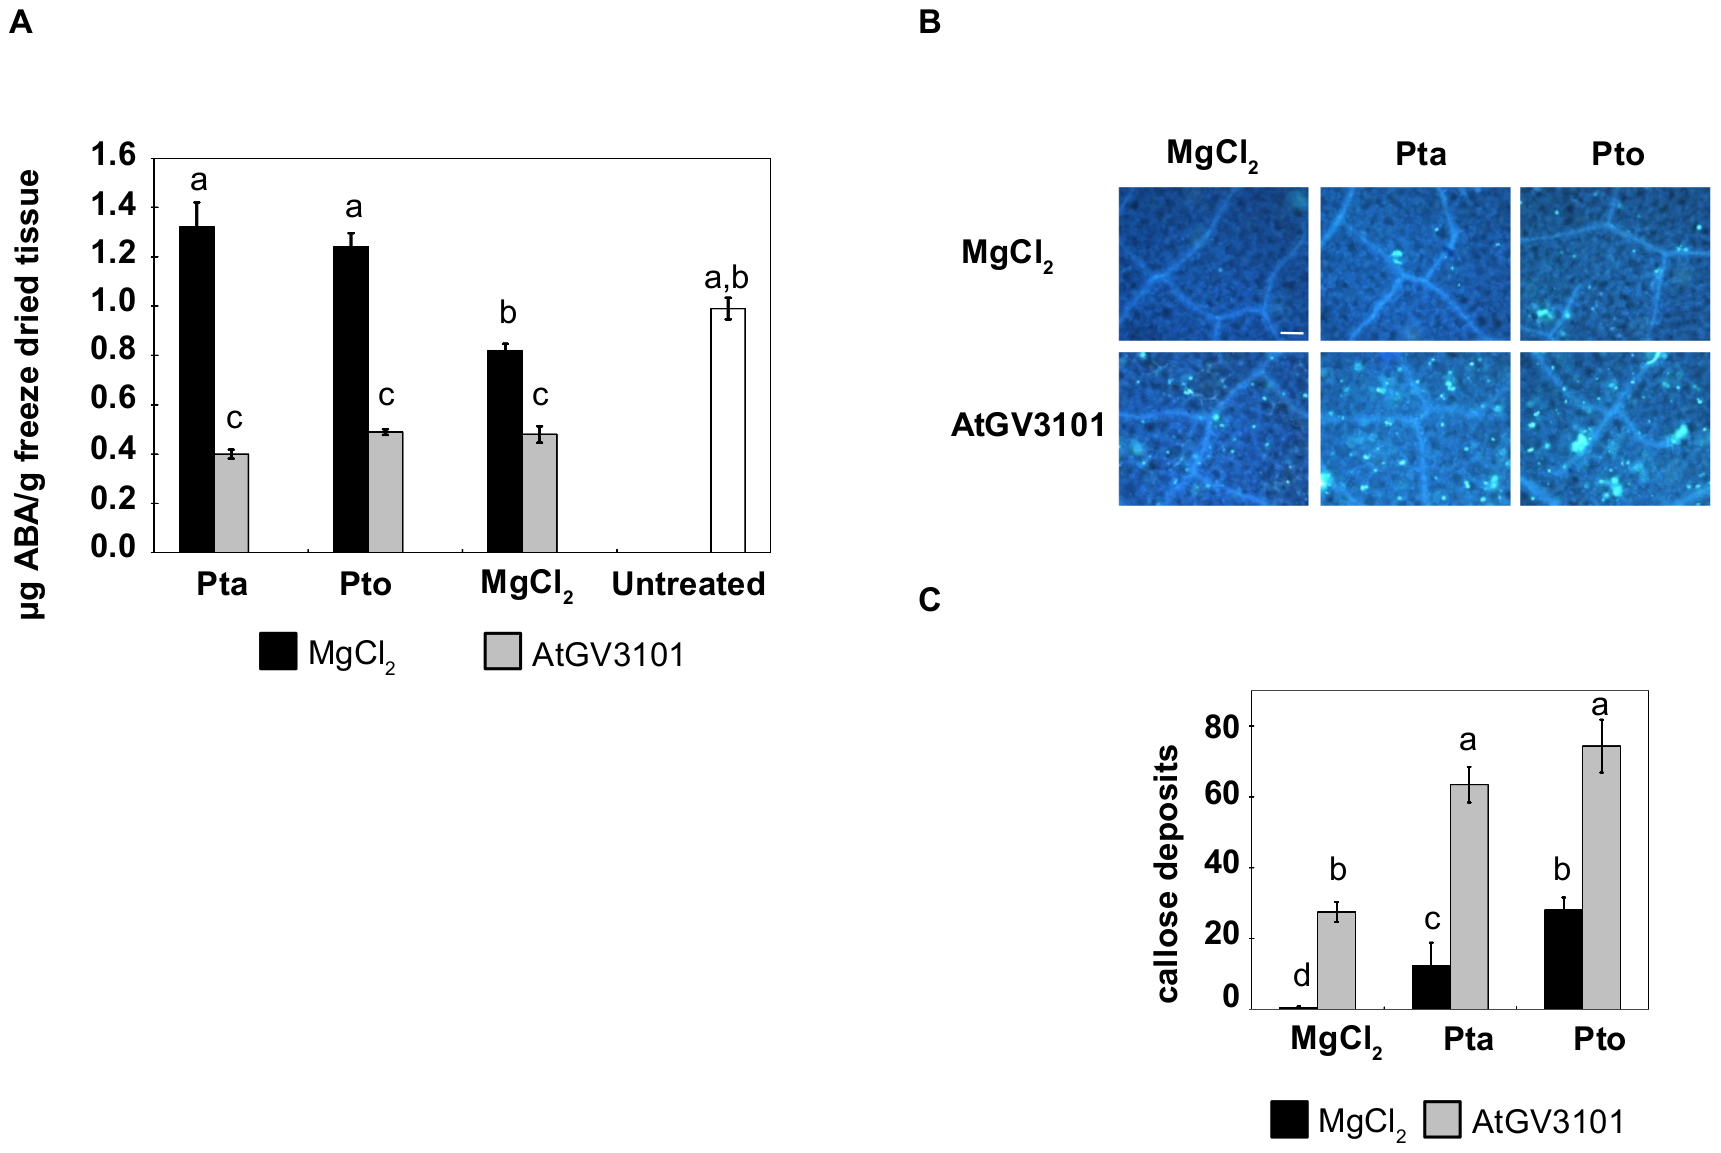
Figure 6B, upper-left panel: aniline-blue-stained tobacco leaf tissue in the MgCl₂ control condition, imaged under ultraviolet excitation. The gallery preview is a cropped detail; the viewer shows the complete original figure. Rico et al. (2010) · Figure 6 · CC BY. Agroinfiltration Reduces ABA Levels and Suppresses Pseudomonas syringae-Elicited Salicylic Acid Production in Nicotiana tabacum .
View source ↗ - 28 — Neural tapestry
Figure 4A, neuron panel: periodic acid–Schiff staining and hematoxylin counterstaining of hiPSC-derived neurons. The gallery preview is a cropped detail; the viewer shows the complete original figure. Hsu et al. (2020) · Fig. 4. · CC BY 4.0. A single-cell Raman-based platform to identify developmental stages of human pluripotent stem cell-derived neurons.
View source ↗ - 29 — A living canopy
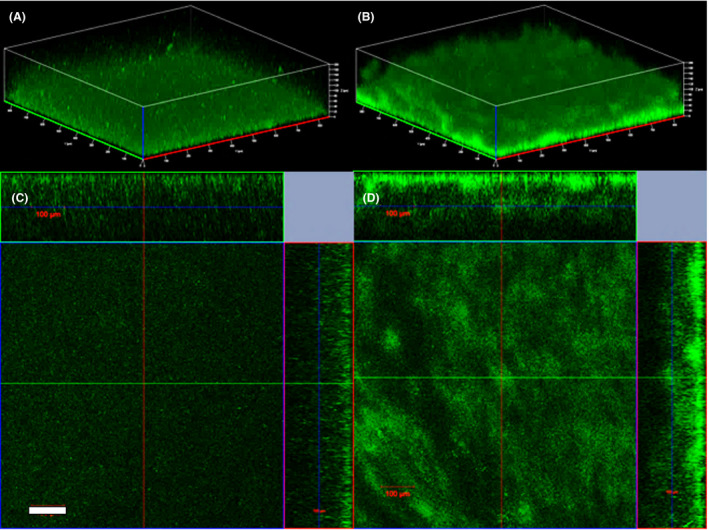
Figure 1A: a three-dimensional confocal reconstruction of wild-type Shewanella oneidensis MR-1 biofilm after 24 hours of growth in a flow cell. The gallery preview is a cropped detail; the viewer shows the complete original figure. Ng et al. (2020) · Fig. 1 · CC BY 4.0. Elevated intracellular cyclic‐di‐GMP level in Shewanella oneidensis increases expression of c‐type cytochromes.
View source ↗ - 30 — A small dark moon
Figure 1B, lower-right panel: an enlarged electron-microscopy view of a chromosome-free SimCell. The gallery preview is a cropped detail; the viewer shows the complete original figure. Rampley et al. (2017) · Figure 1 · CC BY 4.0. Development of SimCells as a novel chassis for functional biosensors.
View source ↗ - 31 — Amber signals
Figure 4E: the lipid-channel image of a mixture of R. glutinis and S. cerevisiae before ejection. The colours encode the measured Raman signal. The gallery preview is a cropped detail; the viewer shows the complete original figure. Zhang et al. (2024) · Fig. 4. · CC BY-NC 4.0. High-throughput single-cell sorting by stimulated Raman-activated cell ejection.
View source ↗ - 32 — Mineral folds
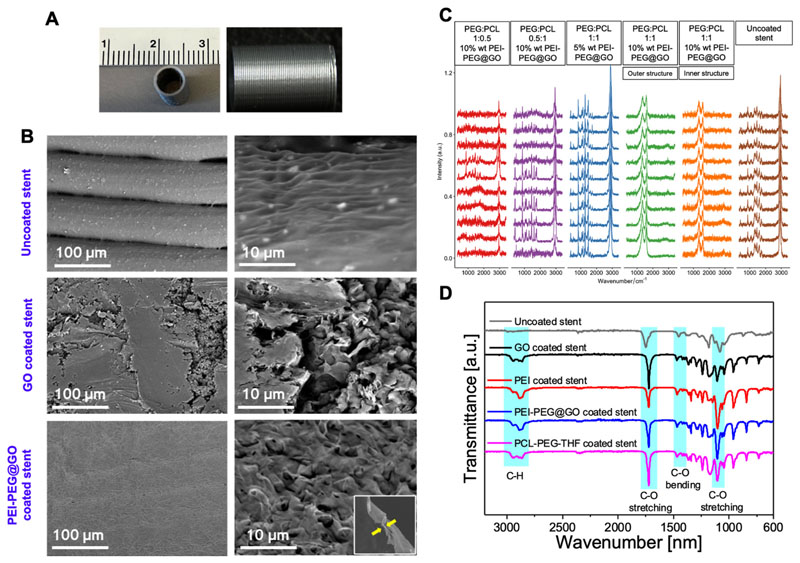
Figure 5b, middle-right panel: the textured surface of a graphene-oxide-coated PLA stent. The gallery preview is a cropped detail; the viewer shows the complete original figure. Tabish et al. (2024) · FIG. 5 · CC BY 4.0. Synthesis and characterization of amine-functionalized graphene as a nitric oxide-generating coating for vascular stents.
View source ↗ - 33 — Emerald interiors
Figure 9A, last fluorescence panel: NO-sensitive staining in MOVAS vascular smooth-muscle cells exposed to SNO-Cys@PGO in vitro. The gallery preview is a cropped detail; the viewer shows the complete original figure. Tabish et al. (2024) · Fig. 9 · CC BY 4.0. S-nitrosocysteamine-functionalised porous graphene oxide nanosheets as nitric oxide delivery vehicles for cardiovascular applications.
View source ↗ - 34 — Circles of growth
Figure 3b: culture plates following single-cell isolation, with yeast, E. coli and Lactobacillus rhamnosus GG arranged in paired columns. The gallery preview is a cropped detail; the viewer shows the complete original figure. Liang et al. (2021) · FIG 3 · CC BY 4.0. Isolation and Culture of Single Microbial Cells by Laser Ejection Sorting Technology.
View source ↗ - 35 — Within the vessel
Figure 2C: bacterial colonies, shown in yellow, within a leaf xylem vessel. Plant-tissue autofluorescence outlines the surrounding structure. The gallery preview is a cropped detail; the viewer shows the complete original figure. Soldan et al. (2021) · Fig. 2 · CC BY 4.0. From macro to micro: a combined bioluminescence‐fluorescence approach to monitor bacterial localization.
View source ↗ - 36 — Scattered in blue
Figure 3I: a stimulated Raman image of E. coli at 2935 cm⁻¹ before cell ejection. The gallery preview is a cropped detail; the viewer shows the complete original figure. Zhang et al. (2024) · Fig. 3. · CC BY-NC 4.0. High-throughput single-cell sorting by stimulated Raman-activated cell ejection.
View source ↗ - 37 — Translucent layers
Figure 2a, lower-left panel: overlapping layers of PEI–PEG-functionalised graphene oxide examined by transmission electron microscopy. The gallery preview is a cropped detail; the viewer shows the complete original figure. Tabish et al. (2024) · FIG. 2 · CC BY 4.0. Synthesis and characterization of amine-functionalized graphene as a nitric oxide-generating coating for vascular stents.
View source ↗ - 38 — Violet interior
Figure 4, tyrosine channel: Raman intensity at 855 cm⁻¹ within the same HeLa cell shown in the other channels of this figure. The gallery preview is a cropped detail; the viewer shows the complete original figure. Xu et al. (2021) · Figure 4 · CC BY 4.0. Unveiling Cancer Metabolism through Spontaneous and Coherent Raman Spectroscopy and Stable Isotope Probing.
View source ↗ - 39 — Leaf light
Figure 1A, upper-right panel: tobacco leaf tissue pretreated with A. tumefaciens GV3101 and subsequently inoculated with P. syringae pv. tomato. The gallery preview is a cropped detail; the viewer shows the complete original figure. Rico et al. (2010) · Figure 1 · CC BY. Agroinfiltration Reduces ABA Levels and Suppresses Pseudomonas syringae-Elicited Salicylic Acid Production in Nicotiana tabacum .
View source ↗ - 40 — Threads of light
Figure 5c, live/dead staining: Rhodococcus cells six hours after laser irradiation. Green and red report staining; the dotted boundary marks the illuminated region. The gallery preview is a cropped detail; the viewer shows the complete original figure. Yuan et al. (2018) · FIG 5 · CC BY 4.0. Effect of Laser Irradiation on Cell Function and Its Implications in Raman Spectroscopy.
View source ↗ - 41 — Rose-coloured tissue
Figure 4A, NSC panel: neural stem cells examined with periodic acid–Schiff staining and hematoxylin counterstaining. The gallery preview is a cropped detail; the viewer shows the complete original figure. Hsu et al. (2020) · Fig. 4. · CC BY 4.0. A single-cell Raman-based platform to identify developmental stages of human pluripotent stem cell-derived neurons.
View source ↗ - 42 — Silver ridges
Figure 3A, right-hand panel: S-nitrosocysteamine-functionalised graphene oxide (SNO-Cys@GO). The gallery preview is a cropped detail; the viewer shows the complete original figure. Tabish et al. (2024) · Fig. 3 · CC BY 4.0. S-nitrosocysteamine-functionalised porous graphene oxide nanosheets as nitric oxide delivery vehicles for cardiovascular applications.
View source ↗ - 43 — A blue constellation
Figure 6B, lower-middle panel: aniline-blue-stained leaf tissue after A. tumefaciens GV3101 pretreatment and P. syringae pv. tabaci inoculation. The gallery preview is a cropped detail; the viewer shows the complete original figure. Rico et al. (2010) · Figure 6 · CC BY. Agroinfiltration Reduces ABA Levels and Suppresses Pseudomonas syringae-Elicited Salicylic Acid Production in Nicotiana tabacum .
View source ↗ - 44 — Tiny satellites
Figure 1B, upper-right panel: electron micrographs of small SimCells produced by aberrant division of engineered E. coli. The gallery preview is a cropped detail; the viewer shows the complete original figure. Rampley et al. (2017) · Figure 1 · CC BY 4.0. Development of SimCells as a novel chassis for functional biosensors.
View source ↗ - 45 — Metabolic islands
Figure 4A: a spectrally summed stimulated Raman image of R. glutinis cells. The original arrows distinguish the cell body and lipid droplets. The gallery preview is a cropped detail; the viewer shows the complete original figure. Zhang et al. (2024) · Fig. 4. · CC BY-NC 4.0. High-throughput single-cell sorting by stimulated Raman-activated cell ejection.
View source ↗ - 46 — Cellular calligraphy
Figure 5c, bright-field panel: the elongated forms of Rhodococcus cells six hours after laser irradiation at 9.2 mJ. The gallery preview is a cropped detail; the viewer shows the complete original figure. Yuan et al. (2018) · FIG 5 · CC BY 4.0. Effect of Laser Irradiation on Cell Function and Its Implications in Raman Spectroscopy.
View source ↗ - 47 — Green architecture
Figure 1D: orthogonal confocal views of biofilm formed by the high-c-di-GMP S. oneidensis MR-1/pYedQ2 strain after 24 hours in a flow cell. The gallery preview is a cropped detail; the viewer shows the complete original figure. Ng et al. (2020) · Fig. 1 · CC BY 4.0. Elevated intracellular cyclic‐di‐GMP level in Shewanella oneidensis increases expression of c‐type cytochromes.
View source ↗ - 48 — An emerald halo
Figure 4, lipid channel: the distribution of Raman intensity at 2845 cm⁻¹ in a HeLa cell. This is a chemical map of the same cell shown in the other channels. The gallery preview is a cropped detail; the viewer shows the complete original figure. Xu et al. (2021) · Figure 4 · CC BY 4.0. Unveiling Cancer Metabolism through Spontaneous and Coherent Raman Spectroscopy and Stable Isotope Probing.
View source ↗ - 49 — Soft ripples
Figure 5b, upper-right panel: the surface of an uncoated PLA stent at higher magnification. The gallery preview is a cropped detail; the viewer shows the complete original figure. Tabish et al. (2024) · FIG. 5 · CC BY 4.0. Synthesis and characterization of amine-functionalized graphene as a nitric oxide-generating coating for vascular stents.
View source ↗ - 50 — A golden section
Figure 5E, upper panel: a five-micrometre-thick rat brain tissue section imaged at 2940 cm⁻¹ before microdissection. The gallery preview is a cropped detail; the viewer shows the complete original figure. Zhang et al. (2024) · Fig. 5. · CC BY-NC 4.0. High-throughput single-cell sorting by stimulated Raman-activated cell ejection.
View source ↗ - 51 — Between the walls
Figure 2E: yellow bacterial colonies among autofluorescent plant cells in a magnified region of the leaf tissue. The gallery preview is a cropped detail; the viewer shows the complete original figure. Soldan et al. (2021) · Fig. 2 · CC BY 4.0. From macro to micro: a combined bioluminescence‐fluorescence approach to monitor bacterial localization.
View source ↗ - 52 — A cellular constellation
Figure 5D, upper panel: live S. cerevisiae cells imaged at 2940 cm⁻¹ before Raman-activated ejection. The gallery preview is a cropped detail; the viewer shows the complete original figure. Zhang et al. (2024) · Fig. 5. · CC BY-NC 4.0. High-throughput single-cell sorting by stimulated Raman-activated cell ejection.
View source ↗ - 53 — Cell in silver
Figure 4, black-and-white reference image: the HeLa cell used for the nucleic-acid, lipid, tyrosine and protein Raman maps. The gallery preview is a cropped detail; the viewer shows the complete original figure. Xu et al. (2021) · Figure 4 · CC BY 4.0. Unveiling Cancer Metabolism through Spontaneous and Coherent Raman Spectroscopy and Stable Isotope Probing.
View source ↗ - 54 — Veins and gradients
Figure 1A, lower-left panel: tobacco leaf tissue six days after P. syringae pv. tabaci inoculation following MgCl₂ pretreatment. The dark outline is an experimental annotation in the original photograph. The gallery preview is a cropped detail; the viewer shows the complete original figure. Rico et al. (2010) · Figure 1 · CC BY. Agroinfiltration Reduces ABA Levels and Suppresses Pseudomonas syringae-Elicited Salicylic Acid Production in Nicotiana tabacum .
View source ↗